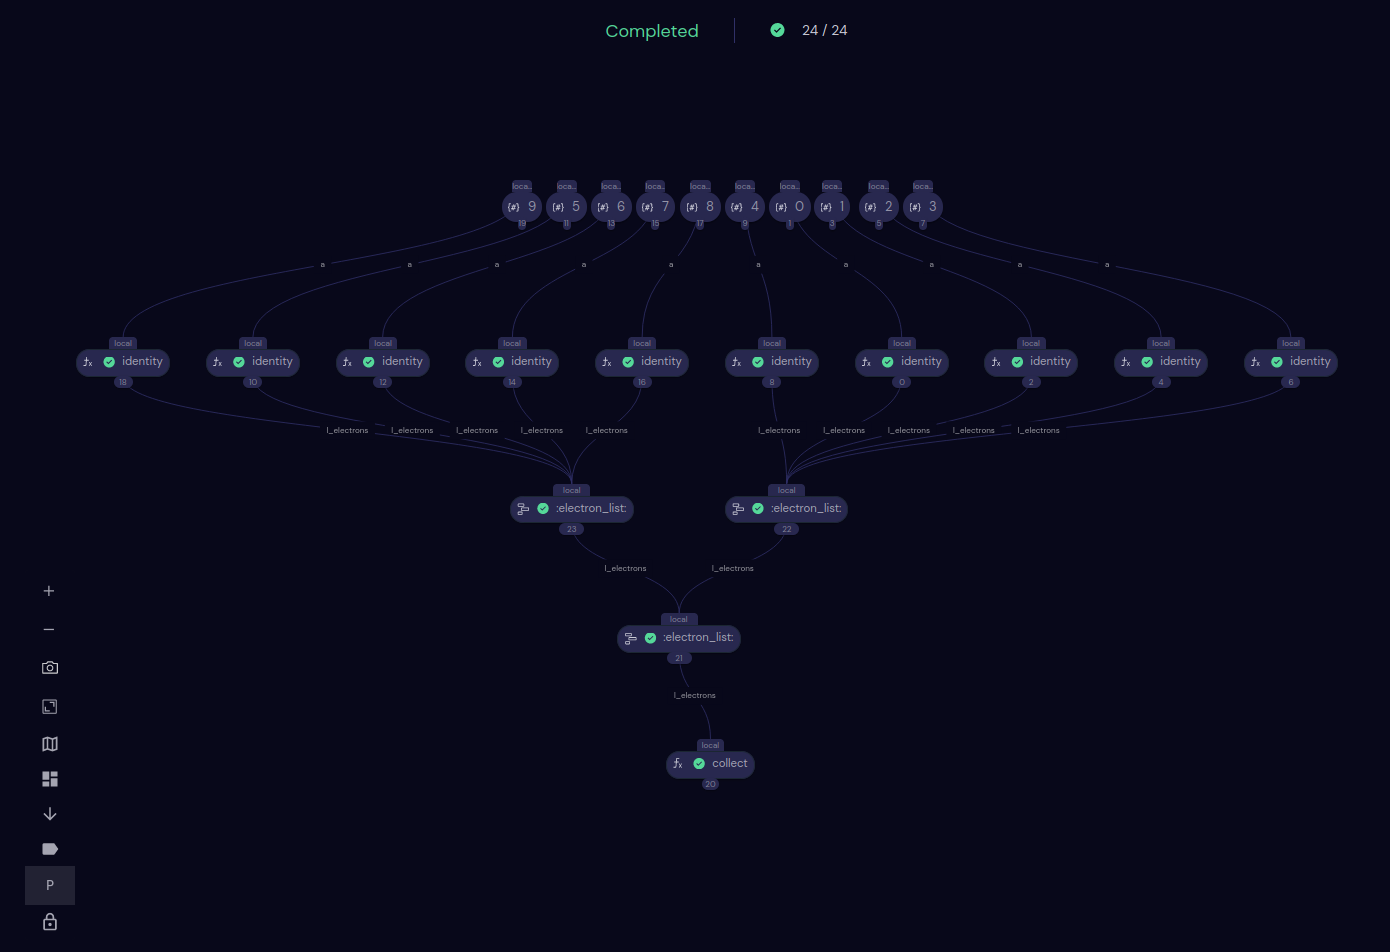
Transport Graph
The Transport Graph displays the directed acyclic graph representing the dispatch.

Controls
On the left edge of the Transport Graph window is a vertical control bar consisting of several icons, shown here to the left. Use these controls to adjust the view of the transport graph.
Note
Adjustments made to the transport graph are lost if you leave the page, for example by going back to the Dashboard screen.
Zoom and
Zoom in and out on the transport graph. To pan, click and drag over the transport graph.
Screenshot
Take a screenshot of the Transport Graph window. Only the transport graph, without the control bar, is captured. The image, a JPG file named after the dispatch ID, is saved in your browser’s default location.
Fit to Screen
Automatically scale the entire transport graph to fit in the available window space.
Layout
Choose a layout for the graph nodes. Clicking  opens a menu with the following options: Layered, Tree, Force, Rectangular, Box, Old Layout.
Labels
Toggle labels on the node on or off. Labels include the executor, the task name, and the node ID.ut.
Parameters
Toggle parameter nodes. Parameter nodes show input parameters to the task nodes. With parameter nodes off (default), the graph displays only electron nodes.
Clicking a parameter node also highlights the dependencies (graph edges) that contain the selected parameter.
Lock Nodes
Toggle locking of draggable nodes. Toggle to “unlock” to enable dragging nodes to improve readability of the graph. Toggle to “lock” (default) to keep from accidentally dragging nodes.